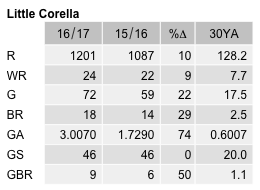
Little Corella
Cacatua sanguinea
ABR description
The following is extracted from the Annual Bird Report for the twelve months to June 2017.
Very common, breeding resident
Once confined to the southern suburbs, now reported from the northern suburbs, surrounding nature reserves and farther afield.
General: Reporting rate (8.6%) is 7% down on last year (9.3%) representing a further decline from the 2015 peak (12.4%) but up 83% on the 30YA (3.9). 31 groups of 200+ reported from Goulburn, North Lyneham, Gowrie, LGin, Wallaroo, Evatt, JWNR and Dickson. Recorded from all seasons with 30% of records in summer and 20% in winter. Average 22.1, median 3 and max 900/7 Jun Hannah Community Park (Fadden) (CaR3). 20 breeding records (14 last year): earliest ih/19 Jul Callum Brae GrL15 (SmA1), latest dy/24 May Fadden (CaR3) with a single report of early activity for next season, ih/5 Jun MFNR (WyP1).
GBS: The abundance was 74% higher than last year and over 5 times the 30YA % to the highest A value recorded for this species since the GBS began. Records from 46 sites from all weeks with 33% of records in summer. Average 11.4, median 3, with max 300/2 wk Dec Kambah (VeP1). Breeding recorded from 5 sites: Curtin, Narrabundah, Greenway, Gleneagles and Watson; earliest ih/1wk Aug Gleneagles (PeH2) and last dy/4wk Mar Narrabundah (PaR9).
Abundance
Abundance is the average number of birds of that species per survey. Where the species was observed (presence recorded) but the number of birds seen was not recorded, this is treated as a count of zero.
Abundance by year
This chart shows the abundance of Little Corella between 1982 and 2017. 
Abundance by month
This chart shows the monthly abundance of Little Corella. The blue lines show the abundance for the twelve months to June 2017 and the bars show the average abundance for the period 1982 to 2017. 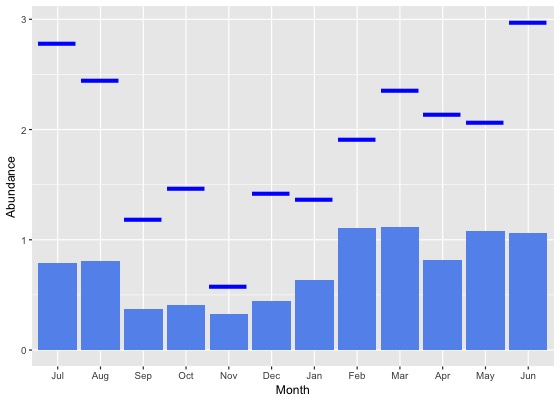
Abundance by season
This chart shows the seasonal abundance of Little Corella. The blue lines show the seasonal abundance for the twelve months to June 2017 and the bars show the average seasonal abundance for the period 1982 to 2017. 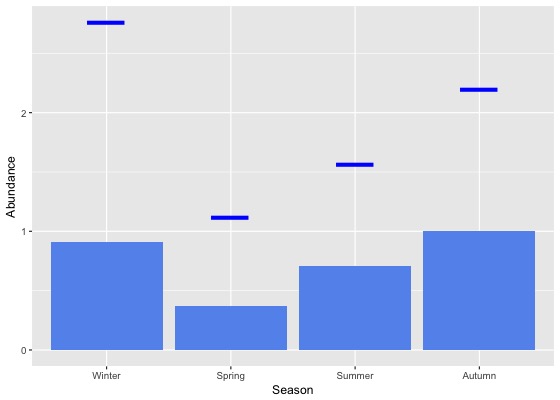
Abundance data
| Month | Season | ||||||||||||||||||
|---|---|---|---|---|---|---|---|---|---|---|---|---|---|---|---|---|---|---|---|
| Period | Jul | Aug | Sep | Oct | Nov | Dec | Jan | Feb | Mar | Apr | May | Jun | Winter | Spring | Summer | Autumn | All | ||
| All years | |||||||||||||||||||
| All | 0.8 | 0.8 | 0.4 | 0.4 | 0.3 | 0.4 | 0.6 | 1.1 | 1.1 | 0.8 | 1.1 | 1.1 | 0.9 | 0.4 | 0.7 | 1.0 | 0.7 | ||
| Previous years | |||||||||||||||||||
| All previous years | 0.5 | 0.5 | 0.3 | 0.3 | 0.3 | 0.3 | 0.5 | 0.9 | 0.9 | 0.6 | 0.9 | 0.7 | 0.6 | 0.3 | 0.5 | 0.8 | 0.5 | ||
| Previous 30 years | 0.5 | 0.5 | 0.3 | 0.3 | 0.3 | 0.3 | 0.5 | 0.9 | 0.9 | 0.6 | 0.9 | 0.7 | 0.6 | 0.3 | 0.6 | 0.8 | 0.5 | ||
| Previous 20 years | 0.6 | 0.7 | 0.3 | 0.3 | 0.4 | 0.4 | 0.6 | 1.1 | 1.1 | 0.7 | 1.1 | 0.8 | 0.7 | 0.3 | 0.7 | 0.9 | 0.6 | ||
| 10 year groups | |||||||||||||||||||
| [2007,2017) | 1.0 | 0.9 | 0.4 | 0.4 | 0.5 | 0.5 | 0.7 | 1.5 | 1.5 | 0.9 | 1.5 | 1.1 | 1.0 | 0.4 | 0.9 | 1.3 | 0.9 | ||
| [1997,2007) | 0.1 | 0.1 | 0.1 | 0.0 | 0.0 | 0.1 | 0.0 | 0.1 | 0.1 | 0.2 | 0.0 | 0.2 | 0.1 | 0.0 | 0.1 | 0.1 | 0.1 | ||
| [1987,1997) | 0.0 | 0.0 | 0.1 | 0.0 | 0.0 | 0.0 | 0.0 | 0.0 | 0.0 | 0.0 | 0.0 | 0.1 | 0.1 | 0.0 | 0.0 | 0.0 | 0.0 | ||
| 5 year groups | |||||||||||||||||||
| [2012,2017) | 1.1 | 1.2 | 0.5 | 0.5 | 0.5 | 0.7 | 0.9 | 1.9 | 1.9 | 1.2 | 1.8 | 1.7 | 1.4 | 0.5 | 1.1 | 1.6 | 1.1 | ||
| [2007,2012) | 0.4 | 0.1 | 0.2 | 0.2 | 0.5 | 0.2 | 0.2 | 0.2 | 0.3 | 0.3 | 0.9 | 0.1 | 0.2 | 0.3 | 0.2 | 0.4 | 0.3 | ||
| [2002,2007) | 0.0 | 0.1 | 0.1 | 0.1 | 0.1 | 0.0 | 0.0 | 0.1 | 0.1 | 0.1 | 0.0 | 0.3 | 0.2 | 0.1 | 0.1 | 0.1 | 0.1 | ||
| [1997,2002) | 0.1 | 0.0 | 0.0 | 0.0 | 0.0 | 0.1 | 0.1 | 0.1 | 0.1 | 0.2 | 0.0 | 0.0 | 0.0 | 0.0 | 0.1 | 0.1 | 0.1 | ||
| [1992,1997) | 0.0 | 0.0 | 0.2 | 0.0 | 0.0 | 0.1 | 0.1 | 0.1 | 0.0 | 0.0 | 0.0 | 0.4 | 0.2 | 0.1 | 0.1 | 0.0 | 0.1 | ||
| [1987,1992) | 0.0 | 0.0 | 0.0 | 0.0 | 0.0 | 0.0 | 0.0 | 0.0 | 0.0 | 0.0 | 0.0 | 0.0 | 0.0 | 0.0 | 0.0 | 0.0 | 0.0 | ||
| Year | |||||||||||||||||||
| 2017 | 2.8 | 2.4 | 1.2 | 1.5 | 0.6 | 1.4 | 1.4 | 1.9 | 2.4 | 2.1 | 2.1 | 3.0 | 2.8 | 1.1 | 1.6 | 2.2 | 1.9 | ||
| 2016 | 0.6 | 1.0 | 0.8 | 0.5 | 0.5 | 0.7 | 1.3 | 2.1 | 3.1 | 1.5 | 2.2 | 3.5 | 1.7 | 0.6 | 1.4 | 2.3 | 1.5 | ||
| 2015 | 2.7 | 2.4 | 0.8 | 0.9 | 0.8 | 1.0 | 1.7 | 2.9 | 2.4 | 1.7 | 1.8 | 1.3 | 2.0 | 0.8 | 1.9 | 2.0 | 1.6 | ||
| 2014 | 1.0 | 0.7 | 0.1 | 0.3 | 0.9 | 0.5 | 0.4 | 1.3 | 1.0 | 0.9 | 1.5 | 1.0 | 0.9 | 0.4 | 0.7 | 1.1 | 0.7 | ||
| 2013 | 0.7 | 1.1 | 0.1 | 0.3 | 0.4 | 0.2 | 0.2 | 0.2 | 0.5 | 0.3 | 0.7 | 0.4 | 0.7 | 0.3 | 0.2 | 0.5 | 0.4 | ||
| 2012 | 0.2 | 0.2 | 0.2 | 0.2 | 0.1 | 0.6 | 0.3 | 0.4 | 0.4 | 0.6 | 1.3 | 0.4 | 0.3 | 0.2 | 0.4 | 0.7 | 0.3 | ||
| 2011 | 0.8 | 0.1 | 0.3 | 0.3 | 1.4 | 0.1 | 0.1 | 0.2 | 0.1 | 0.1 | 0.4 | 0.2 | 0.3 | 0.5 | 0.1 | 0.2 | 0.3 | ||
| 2010 | 0.0 | 0.0 | 0.2 | 0.4 | 0.5 | 0.5 | 0.3 | 0.3 | 0.5 | 0.5 | 2.5 | 0.1 | 0.1 | 0.4 | 0.4 | 0.8 | 0.4 | ||
| 2009 | 0.9 | 0.2 | 0.2 | 0.1 | 0.1 | 0.1 | 0.1 | 0.2 | 0.1 | 0.0 | 0.0 | 0.0 | 0.3 | 0.1 | 0.1 | 0.0 | 0.1 | ||
| 2008 | 0.1 | 0.1 | 0.1 | 0.1 | 0.3 | 0.2 | 0.4 | 0.2 | 0.6 | 0.1 | 0.6 | 0.1 | 0.1 | 0.1 | 0.3 | 0.3 | 0.2 | ||
| 2007 | 0.0 | 0.0 | 0.1 | 0.2 | 0.3 | 0.2 | 0.1 | 0.2 | 0.4 | 0.7 | 1.6 | 0.0 | 0.0 | 0.2 | 0.1 | 0.8 | 0.3 | ||
| 2006 | 0.1 | 0.1 | 0.1 | 0.2 | 0.0 | 0.1 | 0.1 | 0.5 | 0.0 | 0.0 | 0.1 | 1.1 | 0.6 | 0.1 | 0.2 | 0.0 | 0.2 | ||
| 2005 | 0.2 | 0.5 | 0.2 | 0.0 | 0.2 | 0.0 | 0.0 | 0.0 | 0.5 | 0.3 | 0.0 | 0.0 | 0.2 | 0.1 | 0.0 | 0.3 | 0.1 | ||
| 2004 | 0.0 | 0.1 | 0.1 | 0.0 | 0.0 | 0.1 | 0.0 | 0.0 | 0.0 | 0.4 | 0.0 | 0.0 | 0.0 | 0.0 | 0.0 | 0.2 | 0.1 | ||
| 2003 | 0.0 | 0.0 | 0.0 | 0.0 | 0.0 | 0.0 | 0.0 | 0.0 | 0.1 | 0.0 | 0.0 | 0.0 | 0.0 | 0.0 | 0.0 | 0.0 | 0.0 | ||
| 2002 | 0.0 | 0.0 | 0.0 | 0.0 | 0.2 | 0.0 | 0.0 | 0.0 | 0.0 | 0.0 | 0.0 | 0.0 | 0.0 | 0.1 | 0.0 | 0.0 | 0.0 | ||
| 2001 | 0.0 | 0.0 | 0.0 | 0.1 | 0.0 | 0.1 | 0.0 | 0.0 | 0.0 | 0.0 | 0.0 | 0.0 | 0.0 | 0.0 | 0.0 | 0.0 | 0.0 | ||
| 2000 | 0.0 | 0.0 | 0.0 | 0.1 | 0.0 | 0.0 | 0.1 | 0.1 | 0.2 | 0.5 | 0.0 | 0.0 | 0.0 | 0.0 | 0.0 | 0.3 | 0.1 | ||
| 1999 | 0.0 | 0.0 | 0.0 | 0.0 | 0.0 | 0.0 | 0.0 | 0.1 | 0.0 | 0.3 | 0.0 | 0.0 | 0.0 | 0.0 | 0.0 | 0.1 | 0.1 | ||
| 1998 | 0.4 | 0.0 | 0.0 | 0.0 | 0.0 | 0.3 | 0.2 | 0.2 | 0.1 | 0.0 | 0.0 | 0.0 | 0.1 | 0.0 | 0.3 | 0.1 | 0.1 | ||
| 1997 | 0.1 | 0.2 | 0.0 | 0.0 | 0.0 | 0.0 | 0.0 | 0.2 | 0.6 | 0.0 | 0.0 | 0.0 | 0.1 | 0.0 | 0.0 | 0.1 | 0.1 | ||
| 1996 | 0.1 | 0.1 | 0.1 | 0.1 | 0.0 | 0.0 | 0.1 | 0.3 | 0.0 | 0.0 | 0.0 | 1.6 | 0.6 | 0.1 | 0.1 | 0.0 | 0.2 | ||
| 1995 | 0.0 | 0.0 | 0.5 | 0.0 | 0.0 | 0.3 | 0.1 | 0.0 | 0.1 | 0.0 | 0.0 | 0.2 | 0.1 | 0.2 | 0.1 | 0.0 | 0.1 | ||
| 1994 | 0.0 | 0.0 | 0.0 | 0.0 | 0.0 | 0.1 | 0.0 | 0.0 | 0.0 | 0.1 | 0.0 | 0.0 | 0.0 | 0.0 | 0.0 | 0.0 | 0.0 | ||
| 1993 | 0.2 | 0.0 | 0.0 | 0.0 | 0.0 | 0.0 | 0.1 | 0.0 | 0.0 | 0.0 | 0.0 | 0.0 | 0.1 | 0.0 | 0.1 | 0.0 | 0.0 | ||
| 1992 | 0.0 | 0.0 | 0.2 | 0.0 | 0.0 | 0.0 | 0.1 | 0.0 | 0.0 | 0.0 | 0.0 | 0.0 | 0.0 | 0.1 | 0.0 | 0.0 | 0.0 | ||
| 1991 | 0.0 | 0.1 | 0.0 | 0.0 | 0.0 | 0.0 | 0.0 | 0.0 | 0.0 | 0.0 | 0.0 | 0.0 | 0.0 | 0.0 | 0.0 | 0.0 | 0.0 | ||
| 1990 | 0.0 | 0.0 | 0.0 | 0.0 | 0.0 | 0.0 | 0.0 | 0.0 | 0.0 | 0.0 | 0.1 | 0.0 | 0.0 | 0.0 | 0.0 | 0.0 | 0.0 | ||
| 1989 | 0.0 | 0.0 | 0.0 | 0.0 | 0.0 | 0.0 | 0.0 | 0.0 | 0.0 | 0.0 | 0.0 | 0.0 | 0.0 | 0.0 | 0.0 | 0.0 | 0.0 | ||
| 1988 | 0.0 | 0.0 | 0.0 | 0.0 | 0.0 | 0.0 | 0.0 | 0.0 | 0.0 | 0.0 | 0.0 | 0.0 | 0.0 | 0.0 | 0.0 | 0.0 | 0.0 | ||
| 1987 | 0.0 | 0.0 | 0.0 | 0.0 | 0.0 | 0.0 | 0.0 | 0.0 | 0.0 | 0.0 | 0.0 | 0.0 | 0.0 | 0.0 | 0.0 | 0.0 | 0.0 | ||
| 1986 | 0.0 | 0.0 | 0.0 | 0.0 | 0.0 | 0.0 | 0.0 | 0.0 | 0.0 | 0.0 | 0.0 | 0.0 | 0.0 | 0.0 | 0.0 | 0.0 | 0.0 | ||
| 1985 | 0.0 | 0.0 | 0.0 | 0.0 | 0.0 | 0.0 | 0.0 | 0.0 | 0.0 | 0.0 | 0.0 | 0.0 | 0.0 | 0.0 | 0.0 | 0.0 | 0.0 | ||
| 1984 | 0.0 | 0.0 | 0.0 | 0.0 | 0.0 | 0.0 | 0.0 | 0.0 | 0.0 | 0.0 | 0.0 | 0.0 | 0.0 | 0.0 | 0.0 | 0.0 | 0.0 | ||
| 1983 | 0.0 | 0.0 | 0.0 | 0.0 | 0.0 | 0.0 | 0.0 | 0.0 | 0.0 | - | 0.0 | 0.0 | 0.0 | 0.0 | 0.0 | 0.0 | 0.0 | ||
| 1982 | - | 0.0 | - | 0.0 | 0.0 | 0.0 | - | 0.0 | - | 0.0 | - | 0.0 | 0.0 | 0.0 | 0.0 | 0.0 | 0.0 | ||
Reporting rates
Reporting rate is the proportion of all surveys in which the species was present.
Reporting rate by year
This chart shows the reporting rate of Little Corella each year between 1982 and 2017. 
Reporting rate by month
This chart shows the reporting rate by month of Little Corella. The blue lines show the reporting rate for the twelve months to June 2017 and the bars show the average reporting rate for the period 1982 to 2017. 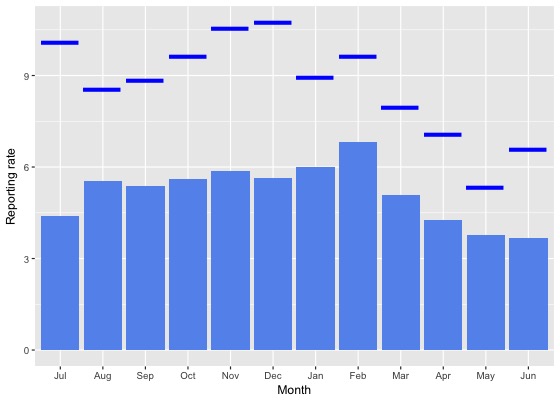
Reporting rate by season
This chart shows the seasonal reporting rate of Little Corella. The blue lines show the seasonal reporting rate for the twelve months to June 2017 and the bars show the average seasonal reporting rate for the period 1982 to 2017. 
Reporting rate data
| Month | Season | ||||||||||||||||||
|---|---|---|---|---|---|---|---|---|---|---|---|---|---|---|---|---|---|---|---|
| Period | Jul | Aug | Sep | Oct | Nov | Dec | Jan | Feb | Mar | Apr | May | Jun | Winter | Spring | Summer | Autumn | All | ||
| All years | |||||||||||||||||||
| All | 4.4 | 5.6 | 5.4 | 5.6 | 5.9 | 5.6 | 6.0 | 6.8 | 5.1 | 4.3 | 3.8 | 3.7 | 4.4 | 5.6 | 6.1 | 4.5 | 5.2 | ||
| Previous years | |||||||||||||||||||
| All previous years | 3.5 | 5.0 | 4.9 | 5.1 | 5.1 | 4.9 | 5.4 | 6.2 | 4.6 | 3.8 | 3.4 | 3.1 | 3.8 | 5.0 | 5.5 | 4.0 | 4.6 | ||
| Previous 30 years | 3.6 | 5.1 | 5.0 | 5.1 | 5.2 | 5.0 | 5.5 | 6.4 | 4.6 | 3.9 | 3.5 | 3.2 | 3.9 | 5.1 | 5.5 | 4.1 | 4.7 | ||
| Previous 20 years | 4.5 | 6.6 | 5.8 | 6.0 | 6.7 | 5.7 | 6.3 | 7.6 | 5.4 | 4.6 | 4.3 | 3.8 | 4.8 | 6.1 | 6.5 | 4.9 | 5.6 | ||
| 10 year groups | |||||||||||||||||||
| [2007,2017) | 6.6 | 9.0 | 7.8 | 7.3 | 9.3 | 7.9 | 7.9 | 10.2 | 7.5 | 6.0 | 6.0 | 5.4 | 6.8 | 7.9 | 8.5 | 6.6 | 7.5 | ||
| [1997,2007) | 1.0 | 1.4 | 1.8 | 1.1 | 1.5 | 1.6 | 1.2 | 1.0 | 1.0 | 0.9 | 0.4 | 0.2 | 0.8 | 1.5 | 1.3 | 0.8 | 1.1 | ||
| [1987,1997) | 0.3 | 0.5 | 0.8 | 0.3 | 0.2 | 0.6 | 0.5 | 0.4 | 0.2 | 0.2 | 0.2 | 0.2 | 0.3 | 0.4 | 0.5 | 0.2 | 0.4 | ||
| 5 year groups | |||||||||||||||||||
| [2012,2017) | 7.5 | 10.6 | 9.2 | 8.7 | 10.2 | 8.6 | 8.6 | 11.9 | 9.2 | 7.4 | 7.3 | 7.1 | 8.3 | 9.2 | 9.6 | 8.1 | 8.9 | ||
| [2007,2012) | 3.9 | 3.2 | 4.5 | 5.0 | 6.8 | 6.4 | 5.2 | 2.8 | 2.7 | 2.7 | 2.3 | 2.4 | 2.9 | 5.2 | 5.2 | 2.6 | 4.2 | ||
| [2002,2007) | 1.0 | 2.3 | 2.7 | 1.5 | 1.8 | 1.9 | 1.5 | 0.6 | 0.4 | 0.7 | 0.6 | 0.2 | 1.0 | 2.0 | 1.5 | 0.6 | 1.3 | ||
| [1997,2002) | 1.0 | 0.4 | 0.7 | 0.6 | 1.3 | 1.2 | 0.9 | 1.4 | 1.8 | 1.0 | 0.2 | 0.3 | 0.5 | 0.9 | 1.1 | 1.1 | 0.9 | ||
| [1992,1997) | 0.9 | 0.7 | 2.3 | 0.9 | 0.6 | 2.1 | 1.5 | 1.4 | 0.5 | 0.5 | 0.3 | 0.5 | 0.7 | 1.2 | 1.7 | 0.4 | 1.0 | ||
| [1987,1992) | 0.0 | 0.4 | 0.1 | 0.0 | 0.0 | 0.0 | 0.0 | 0.0 | 0.0 | 0.0 | 0.1 | 0.0 | 0.1 | 0.0 | 0.0 | 0.0 | 0.1 | ||
| Year | |||||||||||||||||||
| 2017 | 10.1 | 8.6 | 8.8 | 9.6 | 10.6 | 10.7 | 8.9 | 9.6 | 8.0 | 7.1 | 5.3 | 6.6 | 8.1 | 9.7 | 9.7 | 6.9 | 8.6 | ||
| 2016 | 8.6 | 11.4 | 10.6 | 9.8 | 10.7 | 9.6 | 11.9 | 10.2 | 9.5 | 6.3 | 5.8 | 6.3 | 8.9 | 10.3 | 10.6 | 7.4 | 9.3 | ||
| 2015 | 9.6 | 15.7 | 12.8 | 11.5 | 13.0 | 12.0 | 12.5 | 19.0 | 13.7 | 10.4 | 9.9 | 9.2 | 11.1 | 12.3 | 14.3 | 11.5 | 12.4 | ||
| 2014 | 5.5 | 9.2 | 6.8 | 8.8 | 8.9 | 8.1 | 6.6 | 11.1 | 6.1 | 7.7 | 8.1 | 8.1 | 7.9 | 8.2 | 8.2 | 7.1 | 7.9 | ||
| 2013 | 5.9 | 7.7 | 6.0 | 6.0 | 11.0 | 5.3 | 3.4 | 7.9 | 7.9 | 7.9 | 6.3 | 4.7 | 6.0 | 7.4 | 5.2 | 7.6 | 6.6 | ||
| 2012 | 4.0 | 2.8 | 5.1 | 5.3 | 4.1 | 5.4 | 2.7 | 4.9 | 4.5 | 4.4 | 5.9 | 4.8 | 3.9 | 5.0 | 4.0 | 4.7 | 4.5 | ||
| 2011 | 4.9 | 4.0 | 4.3 | 6.3 | 6.1 | 11.3 | 8.9 | 2.7 | 2.2 | 1.6 | 1.8 | 3.5 | 3.9 | 5.7 | 8.3 | 1.9 | 5.0 | ||
| 2010 | 2.1 | 2.6 | 3.7 | 5.5 | 9.1 | 7.3 | 3.4 | 4.7 | 5.5 | 3.8 | 5.9 | 3.4 | 3.0 | 5.8 | 5.5 | 4.9 | 5.0 | ||
| 2009 | 5.8 | 5.2 | 5.3 | 5.0 | 4.5 | 4.8 | 2.0 | 1.7 | 0.9 | 1.6 | 0.0 | 1.8 | 3.7 | 4.9 | 3.1 | 1.0 | 3.5 | ||
| 2008 | 2.8 | 2.6 | 6.0 | 3.3 | 7.4 | 3.2 | 3.2 | 1.9 | 3.2 | 2.5 | 3.6 | 0.9 | 1.9 | 4.6 | 2.9 | 2.9 | 3.4 | ||
| 2007 | 3.3 | 1.9 | 3.3 | 5.7 | 7.4 | 3.4 | 4.7 | 3.5 | 1.7 | 4.7 | 1.6 | 1.6 | 2.0 | 5.3 | 3.9 | 2.9 | 3.7 | ||
| 2006 | 3.9 | 11.7 | 6.2 | 3.6 | 0.6 | 3.9 | 3.4 | 2.2 | 0.0 | 0.5 | 2.2 | 0.4 | 3.7 | 3.7 | 3.3 | 0.6 | 2.8 | ||
| 2005 | 1.5 | 0.9 | 4.1 | 0.6 | 4.1 | 1.6 | 2.1 | 0.0 | 0.9 | 2.2 | 0.0 | 0.4 | 0.8 | 3.0 | 1.4 | 1.0 | 1.6 | ||
| 2004 | 0.0 | 0.7 | 1.0 | 1.2 | 0.6 | 0.9 | 0.6 | 1.0 | 0.0 | 1.1 | 0.0 | 0.0 | 0.2 | 0.9 | 0.8 | 0.4 | 0.6 | ||
| 2003 | 0.0 | 0.0 | 0.4 | 0.0 | 1.4 | 2.5 | 0.7 | 0.0 | 0.9 | 0.0 | 0.8 | 0.0 | 0.0 | 0.6 | 1.3 | 0.5 | 0.6 | ||
| 2002 | 0.0 | 0.0 | 1.5 | 0.0 | 2.5 | 1.2 | 0.6 | 0.0 | 0.5 | 0.0 | 0.0 | 0.0 | 0.0 | 1.3 | 0.8 | 0.2 | 0.6 | ||
| 2001 | 0.9 | 0.6 | 0.6 | 0.8 | 2.3 | 2.9 | 0.0 | 0.5 | 0.3 | 0.0 | 0.0 | 0.5 | 0.7 | 1.1 | 1.3 | 0.1 | 0.8 | ||
| 2000 | 0.0 | 0.0 | 1.4 | 0.9 | 2.3 | 0.7 | 1.7 | 2.4 | 2.0 | 1.8 | 0.0 | 0.0 | 0.0 | 1.5 | 1.5 | 1.5 | 1.2 | ||
| 1999 | 0.0 | 0.0 | 0.6 | 0.0 | 0.0 | 0.0 | 0.7 | 0.7 | 1.6 | 2.1 | 0.6 | 0.5 | 0.3 | 0.2 | 0.5 | 1.4 | 0.7 | ||
| 1998 | 5.4 | 0.0 | 0.8 | 0.0 | 0.0 | 0.9 | 1.5 | 1.9 | 5.4 | 0.0 | 0.0 | 0.0 | 1.2 | 0.3 | 1.3 | 3.1 | 1.3 | ||
| 1997 | 1.1 | 1.7 | 0.0 | 1.3 | 0.9 | 0.0 | 0.0 | 1.8 | 5.0 | 0.0 | 0.0 | 0.0 | 0.9 | 0.7 | 0.5 | 1.0 | 0.8 | ||
| 1996 | 3.0 | 2.1 | 2.7 | 2.6 | 0.9 | 1.0 | 2.9 | 3.5 | 0.0 | 0.0 | 0.0 | 1.1 | 2.0 | 2.0 | 2.4 | 0.0 | 1.7 | ||
| 1995 | 0.0 | 0.0 | 3.9 | 1.2 | 0.9 | 3.4 | 0.9 | 0.0 | 1.0 | 0.0 | 0.0 | 1.1 | 0.3 | 1.9 | 1.5 | 0.3 | 1.0 | ||
| 1994 | 0.0 | 1.3 | 1.5 | 0.0 | 0.7 | 4.3 | 0.0 | 0.0 | 1.1 | 0.8 | 0.0 | 0.0 | 0.5 | 0.7 | 1.2 | 0.7 | 0.7 | ||
| 1993 | 2.0 | 0.0 | 0.0 | 0.0 | 0.0 | 2.2 | 2.0 | 0.0 | 0.0 | 1.7 | 0.0 | 0.0 | 0.5 | 0.0 | 1.6 | 0.5 | 0.5 | ||
| 1992 | 0.0 | 0.0 | 2.4 | 0.0 | 0.0 | 0.0 | 1.7 | 2.4 | 0.0 | 0.0 | 1.3 | 0.0 | 0.0 | 0.8 | 1.2 | 0.5 | 0.6 | ||
| 1991 | 0.0 | 3.2 | 1.2 | 0.0 | 0.0 | 0.0 | 0.0 | 0.0 | 0.0 | 0.0 | 0.0 | 0.0 | 1.1 | 0.3 | 0.0 | 0.0 | 0.4 | ||
| 1990 | 0.0 | 0.0 | 0.0 | 0.0 | 0.0 | 0.0 | 0.0 | 0.0 | 0.0 | 0.0 | 1.4 | 0.0 | 0.0 | 0.0 | 0.0 | 0.4 | 0.1 | ||
| 1989 | 0.0 | 0.0 | 0.0 | 0.0 | 0.0 | 0.0 | 0.0 | 0.0 | 0.0 | 0.0 | 0.0 | 0.0 | 0.0 | 0.0 | 0.0 | 0.0 | 0.0 | ||
| 1988 | 0.0 | 0.0 | 0.0 | 0.0 | 0.0 | 0.0 | 0.0 | 0.0 | 0.0 | 0.0 | 0.0 | 0.0 | 0.0 | 0.0 | 0.0 | 0.0 | 0.0 | ||
| 1987 | 0.0 | 0.0 | 0.0 | 0.0 | 0.0 | 0.0 | 0.0 | 0.0 | 0.0 | 0.0 | 0.0 | 0.0 | 0.0 | 0.0 | 0.0 | 0.0 | 0.0 | ||
| 1986 | 0.0 | 0.0 | 0.0 | 0.0 | 0.0 | 0.0 | 0.0 | 0.0 | 0.0 | 0.0 | 0.0 | 0.0 | 0.0 | 0.0 | 0.0 | 0.0 | 0.0 | ||
| 1985 | 0.0 | 0.0 | 0.0 | 0.0 | 0.0 | 0.0 | 0.0 | 0.0 | 0.0 | 0.0 | 0.0 | 0.0 | 0.0 | 0.0 | 0.0 | 0.0 | 0.0 | ||
| 1984 | 0.0 | 0.0 | 0.0 | 0.0 | 0.0 | 0.0 | 0.0 | 0.0 | 0.0 | 0.0 | 0.0 | 0.0 | 0.0 | 0.0 | 0.0 | 0.0 | 0.0 | ||
| 1983 | 0.0 | 0.0 | 0.0 | 0.0 | 0.0 | 0.0 | 0.0 | 0.0 | 0.0 | - | 0.0 | 0.0 | 0.0 | 0.0 | 0.0 | 0.0 | 0.0 | ||
| 1982 | - | 0.0 | - | 0.0 | 0.0 | 0.0 | - | 0.0 | - | 0.0 | - | 0.0 | 0.0 | 0.0 | 0.0 | 0.0 | 0.0 | ||
Breeding data
Breeding records by month
Number of breeding records by breeding code and month, 2017 and all years| Breeding code | Jul | Aug | Sep | Oct | Nov | Dec | Jan | Feb | Mar | Apr | May | Jun |
|---|---|---|---|---|---|---|---|---|---|---|---|---|
| 2017 | ||||||||||||
| Breeding (BLA code) | 0 | 1 | 1 | 0 | 1 | 0 | 0 | 0 | 0 | 0 | 0 | 0 |
| Carrying Food | 0 | 0 | 0 | 0 | 0 | 0 | 0 | 0 | 0 | 0 | 0 | 0 |
| Copulating | 0 | 0 | 0 | 0 | 0 | 0 | 0 | 0 | 0 | 0 | 0 | 0 |
| Display | 0 | 0 | 0 | 0 | 0 | 0 | 0 | 0 | 0 | 0 | 0 | 0 |
| Dependent young | 0 | 0 | 0 | 0 | 0 | 1 | 0 | 0 | 1 | 1 | 1 | 0 |
| Faecal sac | 0 | 0 | 0 | 0 | 0 | 0 | 0 | 0 | 0 | 0 | 0 | 0 |
| Inspecting hollow | 1 | 2 | 0 | 3 | 0 | 0 | 0 | 0 | 0 | 0 | 0 | 1 |
| Nest building | 0 | 0 | 0 | 0 | 0 | 0 | 0 | 0 | 0 | 0 | 0 | 0 |
| Nest with eggs | 0 | 0 | 0 | 0 | 0 | 0 | 0 | 0 | 0 | 0 | 0 | 0 |
| Nest with young | 0 | 0 | 0 | 1 | 0 | 0 | 0 | 0 | 0 | 0 | 0 | 0 |
| On/leaving nest | 0 | 0 | 2 | 2 | 0 | 0 | 1 | 0 | 0 | 0 | 0 | 0 |
| All years | ||||||||||||
| Breeding (BLA code) | 0 | 1 | 2 | 1 | 2 | 0 | 0 | 0 | 0 | 0 | 0 | 0 |
| Carrying Food | 0 | 0 | 0 | 0 | 0 | 0 | 0 | 0 | 0 | 0 | 0 | 0 |
| Copulating | 0 | 0 | 0 | 0 | 0 | 0 | 0 | 0 | 0 | 0 | 0 | 0 |
| Display | 0 | 0 | 2 | 0 | 0 | 0 | 0 | 0 | 0 | 0 | 0 | 0 |
| Dependent young | 0 | 0 | 0 | 1 | 0 | 2 | 3 | 2 | 4 | 2 | 1 | 0 |
| Faecal sac | 0 | 0 | 0 | 0 | 0 | 0 | 0 | 0 | 0 | 0 | 0 | 0 |
| Inspecting hollow | 1 | 6 | 13 | 14 | 3 | 0 | 1 | 0 | 1 | 0 | 0 | 1 |
| Nest building | 0 | 1 | 1 | 0 | 0 | 1 | 0 | 0 | 0 | 0 | 0 | 0 |
| Nest with eggs | 0 | 0 | 0 | 0 | 0 | 0 | 0 | 0 | 0 | 0 | 0 | 0 |
| Nest with young | 0 | 0 | 0 | 1 | 0 | 0 | 1 | 0 | 0 | 0 | 0 | 0 |
| On/leaving nest | 0 | 1 | 5 | 10 | 6 | 4 | 1 | 0 | 0 | 0 | 0 | 0 |
Breeding records by year
Average number of breeding records per period by breeding code| Period | Breeding (BLA code) | Carrying Food | Copulating | Display | Dependent young | Faecal sac | Inspecting hollow | Nest building | Nest with eggs | Nest with young | On/leaving nest |
|---|---|---|---|---|---|---|---|---|---|---|---|
| All years | |||||||||||
| All | 0.2 | 0.0 | 0.0 | 0.1 | 0.4 | 0.0 | 1.1 | 0.1 | 0.0 | 0.1 | 0.8 |
| Previous years | |||||||||||
| All previous years | 0.1 | 0.0 | 0.0 | 0.1 | 0.3 | 0.0 | 0.9 | 0.1 | 0.0 | 0.0 | 0.6 |
| Previous 30 years | 0.1 | 0.0 | 0.0 | 0.1 | 0.4 | 0.0 | 1.1 | 0.1 | 0.0 | 0.0 | 0.7 |
| Previous 20 years | 0.1 | 0.0 | 0.0 | 0.1 | 0.5 | 0.0 | 1.4 | 0.1 | 0.0 | 0.0 | 1.1 |
| 10 year groups | |||||||||||
| [2007,2017) | 0.1 | 0.0 | 0.0 | 0.1 | 0.9 | 0.0 | 2.6 | 0.2 | 0.0 | 0.0 | 1.6 |
| [1997,2007) | 0.2 | 0.0 | 0.0 | 0.1 | 0.1 | 0.0 | 0.3 | 0.1 | 0.0 | 0.0 | 0.5 |
| [1987,1997) | 0.0 | 0.0 | 0.0 | 0.0 | 0.1 | 0.0 | 0.4 | 0.0 | 0.0 | 0.1 | 0.1 |
| 5 year groups | |||||||||||
| [2012,2017) | 0.2 | 0.0 | 0.0 | 0.2 | 1.8 | 0.0 | 4.2 | 0.2 | 0.0 | 0.0 | 2.4 |
| [2007,2012) | 0.0 | 0.0 | 0.0 | 0.0 | 0.0 | 0.0 | 1.0 | 0.2 | 0.0 | 0.0 | 0.8 |
| [2002,2007) | 0.0 | 0.0 | 0.0 | 0.2 | 0.2 | 0.0 | 0.4 | 0.2 | 0.0 | 0.0 | 0.4 |
| [1997,2002) | 0.4 | 0.0 | 0.0 | 0.0 | 0.0 | 0.0 | 0.2 | 0.0 | 0.0 | 0.0 | 0.6 |
| [1992,1997) | 0.0 | 0.0 | 0.0 | 0.0 | 0.2 | 0.0 | 0.8 | 0.0 | 0.0 | 0.2 | 0.2 |
| [1987,1992) | 0.0 | 0.0 | 0.0 | 0.0 | 0.0 | 0.0 | 0.0 | 0.0 | 0.0 | 0.0 | 0.0 |
| Year | |||||||||||
| 2017 | 3.0 | 0.0 | 0.0 | 0.0 | 4.0 | 0.0 | 7.0 | 0.0 | 0.0 | 1.0 | 5.0 |
| 2016 | 0.0 | 0.0 | 0.0 | 1.0 | 5.0 | 0.0 | 3.0 | 0.0 | 0.0 | 0.0 | 5.0 |
| 2015 | 0.0 | 0.0 | 0.0 | 0.0 | 3.0 | 0.0 | 9.0 | 0.0 | 0.0 | 0.0 | 0.0 |
| 2014 | 0.0 | 0.0 | 0.0 | 0.0 | 0.0 | 0.0 | 4.0 | 1.0 | 0.0 | 0.0 | 3.0 |
| 2013 | 1.0 | 0.0 | 0.0 | 0.0 | 0.0 | 0.0 | 4.0 | 0.0 | 0.0 | 0.0 | 2.0 |
| 2012 | 0.0 | 0.0 | 0.0 | 0.0 | 1.0 | 0.0 | 1.0 | 0.0 | 0.0 | 0.0 | 2.0 |
| 2011 | 0.0 | 0.0 | 0.0 | 0.0 | 0.0 | 0.0 | 1.0 | 0.0 | 0.0 | 0.0 | 0.0 |
| 2010 | 0.0 | 0.0 | 0.0 | 0.0 | 0.0 | 0.0 | 1.0 | 1.0 | 0.0 | 0.0 | 0.0 |
| 2009 | 0.0 | 0.0 | 0.0 | 0.0 | 0.0 | 0.0 | 1.0 | 0.0 | 0.0 | 0.0 | 1.0 |
| 2008 | 0.0 | 0.0 | 0.0 | 0.0 | 0.0 | 0.0 | 1.0 | 0.0 | 0.0 | 0.0 | 2.0 |
| 2007 | 0.0 | 0.0 | 0.0 | 0.0 | 0.0 | 0.0 | 1.0 | 0.0 | 0.0 | 0.0 | 1.0 |
| 2006 | 0.0 | 0.0 | 0.0 | 0.0 | 0.0 | 0.0 | 0.0 | 0.0 | 0.0 | 0.0 | 1.0 |
| 2005 | 0.0 | 0.0 | 0.0 | 1.0 | 0.0 | 0.0 | 1.0 | 0.0 | 0.0 | 0.0 | 0.0 |
| 2004 | 0.0 | 0.0 | 0.0 | 0.0 | 0.0 | 0.0 | 0.0 | 0.0 | 0.0 | 0.0 | 1.0 |
| 2003 | 0.0 | 0.0 | 0.0 | 0.0 | 1.0 | 0.0 | 0.0 | 0.0 | 0.0 | 0.0 | 0.0 |
| 2002 | 0.0 | 0.0 | 0.0 | 0.0 | 0.0 | 0.0 | 1.0 | 1.0 | 0.0 | 0.0 | 0.0 |
| 2001 | 0.0 | 0.0 | 0.0 | 0.0 | 0.0 | 0.0 | 1.0 | 0.0 | 0.0 | 0.0 | 2.0 |
| 2000 | 2.0 | 0.0 | 0.0 | 0.0 | 0.0 | 0.0 | 0.0 | 0.0 | 0.0 | 0.0 | 0.0 |
| 1999 | 0.0 | 0.0 | 0.0 | 0.0 | 0.0 | 0.0 | 0.0 | 0.0 | 0.0 | 0.0 | 0.0 |
| 1998 | 0.0 | 0.0 | 0.0 | 0.0 | 0.0 | 0.0 | 0.0 | 0.0 | 0.0 | 0.0 | 0.0 |
| 1997 | 0.0 | 0.0 | 0.0 | 0.0 | 0.0 | 0.0 | 0.0 | 0.0 | 0.0 | 0.0 | 1.0 |
| 1996 | 0.0 | 0.0 | 0.0 | 0.0 | 0.0 | 0.0 | 4.0 | 0.0 | 0.0 | 1.0 | 1.0 |
| 1995 | 0.0 | 0.0 | 0.0 | 0.0 | 0.0 | 0.0 | 0.0 | 0.0 | 0.0 | 0.0 | 0.0 |
| 1994 | 0.0 | 0.0 | 0.0 | 0.0 | 1.0 | 0.0 | 0.0 | 0.0 | 0.0 | 0.0 | 0.0 |
| 1993 | 0.0 | 0.0 | 0.0 | 0.0 | 0.0 | 0.0 | 0.0 | 0.0 | 0.0 | 0.0 | 0.0 |
| 1992 | 0.0 | 0.0 | 0.0 | 0.0 | 0.0 | 0.0 | 0.0 | 0.0 | 0.0 | 0.0 | 0.0 |
| 1991 | 0.0 | 0.0 | 0.0 | 0.0 | 0.0 | 0.0 | 0.0 | 0.0 | 0.0 | 0.0 | 0.0 |
| 1990 | 0.0 | 0.0 | 0.0 | 0.0 | 0.0 | 0.0 | 0.0 | 0.0 | 0.0 | 0.0 | 0.0 |
| 1989 | 0.0 | 0.0 | 0.0 | 0.0 | 0.0 | 0.0 | 0.0 | 0.0 | 0.0 | 0.0 | 0.0 |
| 1988 | 0.0 | 0.0 | 0.0 | 0.0 | 0.0 | 0.0 | 0.0 | 0.0 | 0.0 | 0.0 | 0.0 |
| 1987 | 0.0 | 0.0 | 0.0 | 0.0 | 0.0 | 0.0 | 0.0 | 0.0 | 0.0 | 0.0 | 0.0 |
| 1986 | 0.0 | 0.0 | 0.0 | 0.0 | 0.0 | 0.0 | 0.0 | 0.0 | 0.0 | 0.0 | 0.0 |
| 1985 | 0.0 | 0.0 | 0.0 | 0.0 | 0.0 | 0.0 | 0.0 | 0.0 | 0.0 | 0.0 | 0.0 |
| 1984 | 0.0 | 0.0 | 0.0 | 0.0 | 0.0 | 0.0 | 0.0 | 0.0 | 0.0 | 0.0 | 0.0 |
| 1983 | 0.0 | 0.0 | 0.0 | 0.0 | 0.0 | 0.0 | 0.0 | 0.0 | 0.0 | 0.0 | 0.0 |
| 1982 | 0.0 | 0.0 | 0.0 | 0.0 | 0.0 | 0.0 | 0.0 | 0.0 | 0.0 | 0.0 | 0.0 |
Distribution map
Distribution - 2017
This map shows the observed distribution of the Little Corella for 2017.
The red circles are the grid cells where Little Corella have been reported.
The transparency of the red circles indicate how many surveys sheets were submitted for that grid cell; the darker the red the more reliable the data. Of the 315 grid cells with reports, 83 had only one sheet; an example is grid number H2.
The size of the circle represents the reporting rate. The maximum reporting rate for Little Corella was 100.0% (eg grid number H2) and the minimum was 0.6% (eg grid number K10). 
Distribution - all years
This map shows the observed distribution of the Little Corella for all years.
The red circles are the grid cells where Little Corella have been reported.
The transparency of the red circles indicate how many surveys sheets were submitted for that grid cell; the darker the red the more reliable the data. Of the 703 grid cells with reports, 55 had only one sheet; an example is grid number A12.
The size of the circle represents the reporting rate. The maximum reporting rate for Little Corella was 35.5% (eg grid number Z1) and the minimum was 0.3% (eg grid number F18). 
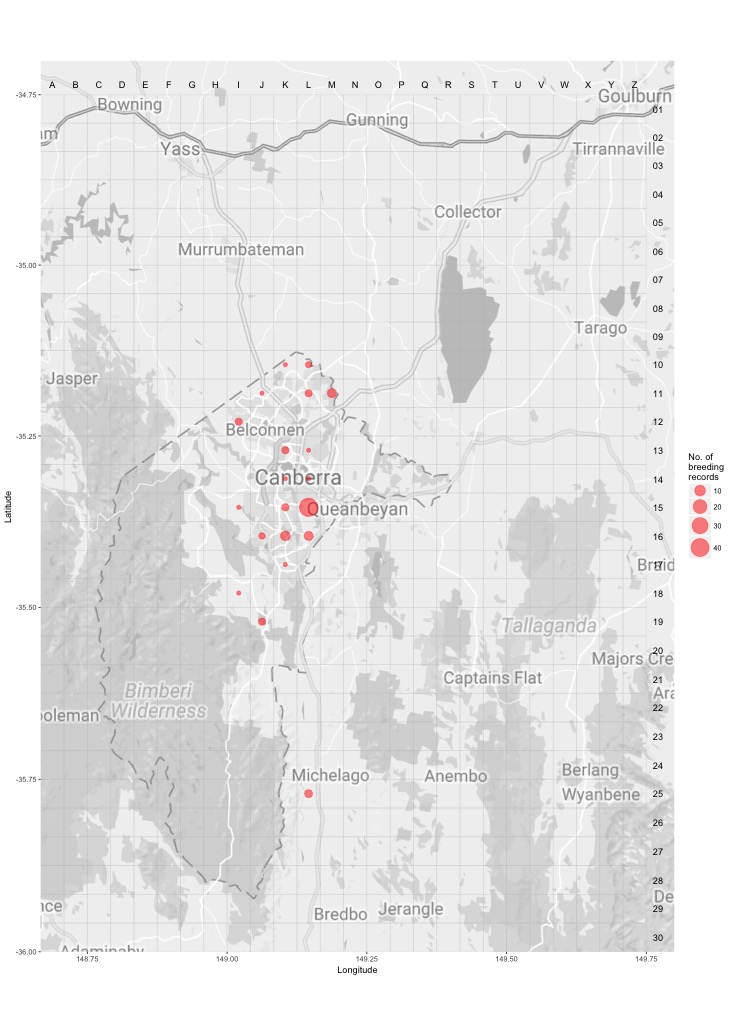
Breeding map
Breeding - 2017
This map shows the breeding distribution of the Little Corella for 2017.
The red circles are the grid cells where breeding activity for Little Corella have been reported.
The size of the circle represents the number of reports. 
Breeding - all years
This map shows the breeding distribution of the Little Corella for all years.
The red circles are the grid cells where breeding activity for Little Corella have been reported.
The size of the circle represents the number of reports.